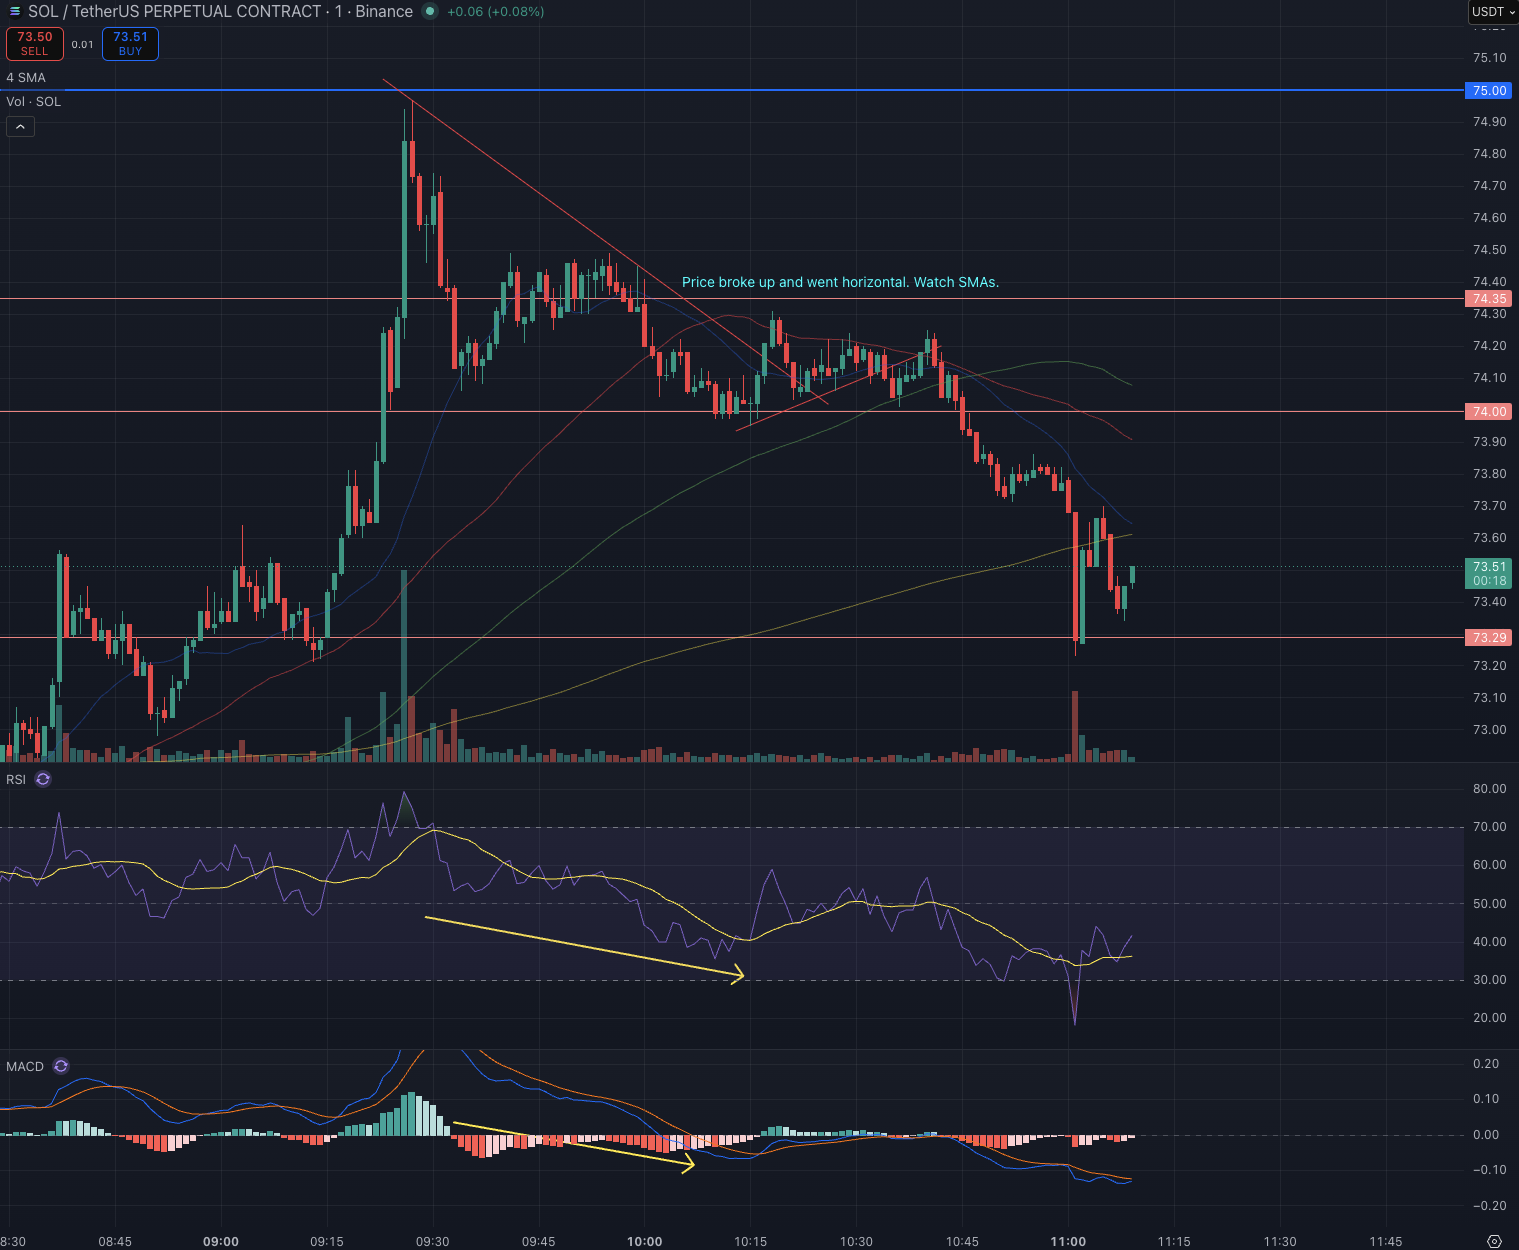
Descending Triangle
A descending triangle is a popular bearish chart pattern in technical analysis.
A descending triangle is a popular bearish chart pattern in technical analysis. It features a flat, horizontal support line and a downward-sloping upper trendline connecting lower highs. This structure signals that selling pressure is increasing as buyers struggle to push the price higher.
Entry
Classic breakdown trade:
- Wait for a candle close below the flat support on your primary timeframe (5m for you)
- Avoid entering on the wick alone — body close matters
- On 1m, you can watch for a retest of the broken support (now resistance) for a tighter entry
Aggressive entry:
- Enter as price approaches the apex with strong bearish momentum, anticipating the break — higher risk, better R:R
Stop Loss
- Above the most recent lower high inside the triangle, or
- Above the flat support line (a few pips buffer) if you entered on retest
Take Profit
- Measure the height of the triangle (from the first high to the flat support) and project it downward from the breakout point — that's your measured move target
- Also watch key HTF support levels (15m/1H) as partial TP zones
Volume Confirmation
- Volume should contract as price coils inside the triangle
- A volume spike on breakdown increases conviction significantly
- Low-volume breakdowns are prone to fakeouts
Fakeout Management
- If price breaks below but wicks back above the support within 1–2 candles, that's a red flag — exit or reduce size
- On 1m, a false break followed by a strong reclaim of support = invalidation
When a Descending Triangle Breaks UP
Studies suggest descending triangles break upward roughly 30–40% of the time — so it's not rare.
Why It Happens
Exhausted sellers — price keeps testing support but sellers can't push it lower. Each lower high is actually getting weaker, and buyers absorb every dip. Eventually buyers overwhelm the remaining sellers.
Bear trap / liquidity grab — price briefly wicks below the flat support to hunt stop losses, then violently reverses upward. This is the classic Wyckoff Spring inside a descending triangle.
BTC pumps unexpectedly — on SOL especially, a sudden BTC spike can invalidate the entire bearish structure mid-pattern.
Signs the Upside Breakout Is Coming
- Flat support holds repeatedly with strong rejection wicks (buyers defending hard)
- Volume on the bounces is increasing while volume on the drops is shrinking
- Lower highs are getting less steep — compression slowing down
- BTC is holding HTF support or starting to turn up
- RSI/MACD showing bullish divergence while price makes the lower highs
How to Trade the Reversal Scenario
Don't short blindly at the apex — if you see the signs above, wait for the breakout direction to confirm.
The spring play: if price wicks below support but closes back above it on the same candle (or next), that's a long entry with SL below the wick low. This is high R:R.
Breakout above the descending trendline — that's your early signal. A close above the most recent lower high confirms bullish intent.
Measured move upside target — same logic, same triangle height, projected upward from the breakout point.
What Is a Fakeout?
Price breaks below the flat support convincingly enough to trigger stop losses and short entries — then reverses hard back inside the triangle and rips upward. The breakdown was a liquidity grab, not a real break.
Why Fakeouts Happen
- Market makers / smart money need liquidity below support — retail traders park their stops just below the flat line, so price dips there to fill those orders, then reverses
- On low-volume sessions, a single large sell order can push price below support briefly without real follow-through
- Thin order books on SOL futures means fakeouts happen faster and more violently than on BTC
How to Identify a Fakeout in Real Time
Candle behaviour is everything:
- Price closes below support but the next 1–2 candles close back above — strong fakeout signal
- The breakdown candle has a long wick with small body — sellers couldn't hold it
- Volume on the breakdown is low or average — no real conviction
On your 1m chart:
- Watch how price behaves immediately after the break — does it stall and creep back up, or does it accelerate down?
- A fakeout usually snaps back within 3–5 candles on 1m
BTC divergence:
- SOL breaks down but BTC isn't breaking — massive fakeout warning
- Always cross-check BTC in real time when SOL hits support