arrow_back
Chart patterns
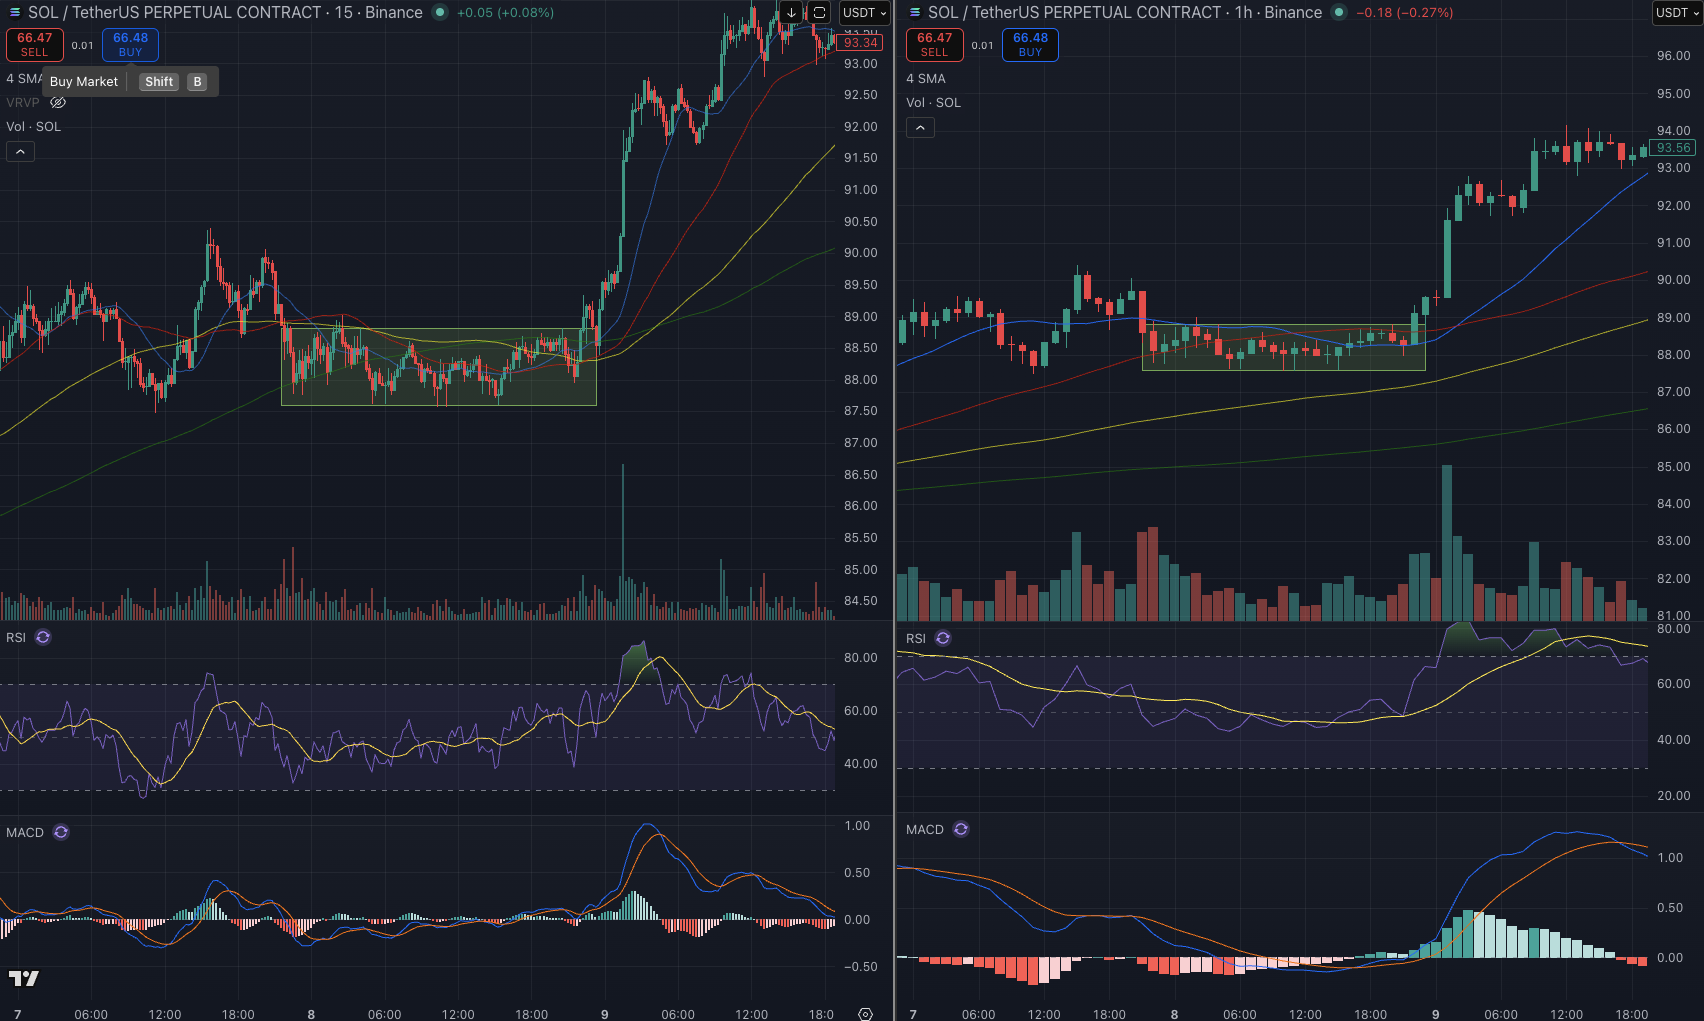
Accumulation - Breakout
event
Posted Jun 9, 2026
update
Updated Jul 10, 2026
Trade when prices consolidate within a defined channel.
In trading, accumulation is a phase where larger players (institutions, funds, whales, smart money) are quietly buying an asset over time without pushing the price up too quickly.
Think of it like this:
- If someone wants to buy 10,000 BTC at once, the price would shoot up.
- Instead, they buy gradually over days or weeks.
- During this period, price often moves sideways in a range.
Simple Example
Imagine a stock or crypto has fallen from $100 to $60.
Then for several weeks:
- Price stays between $58 and $65.
- Every time it drops near $58, buyers step in.
- Volume may increase on up candles.
- Selling pressure gradually weakens.
This is often considered an accumulation zone.
MA Compression
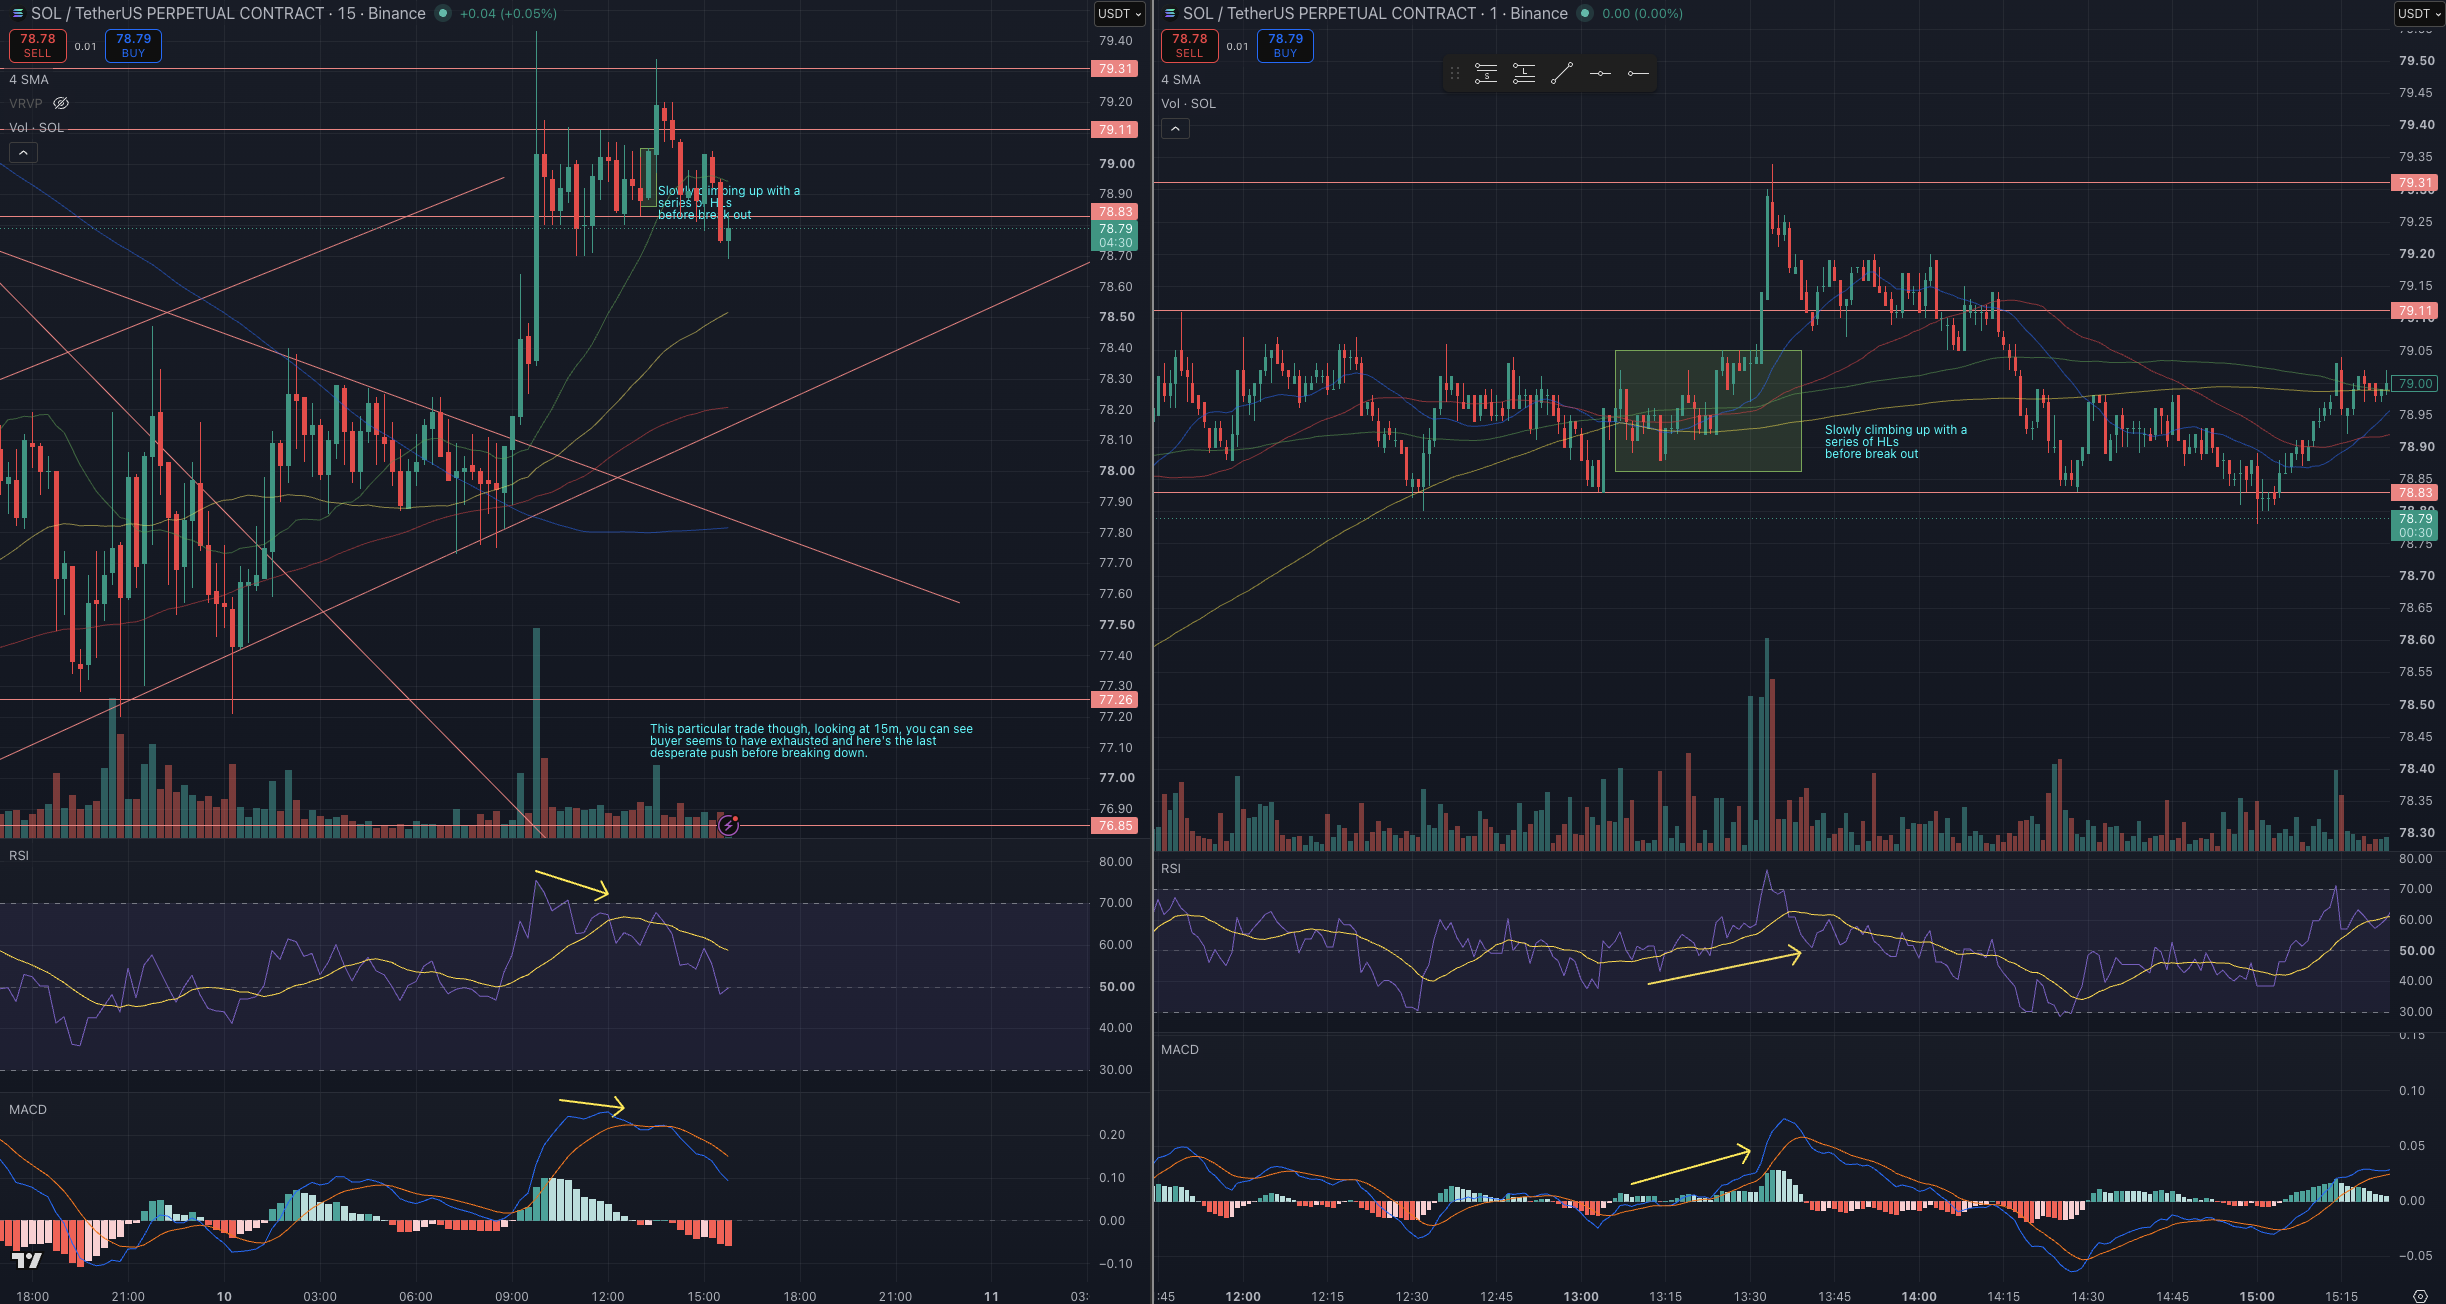
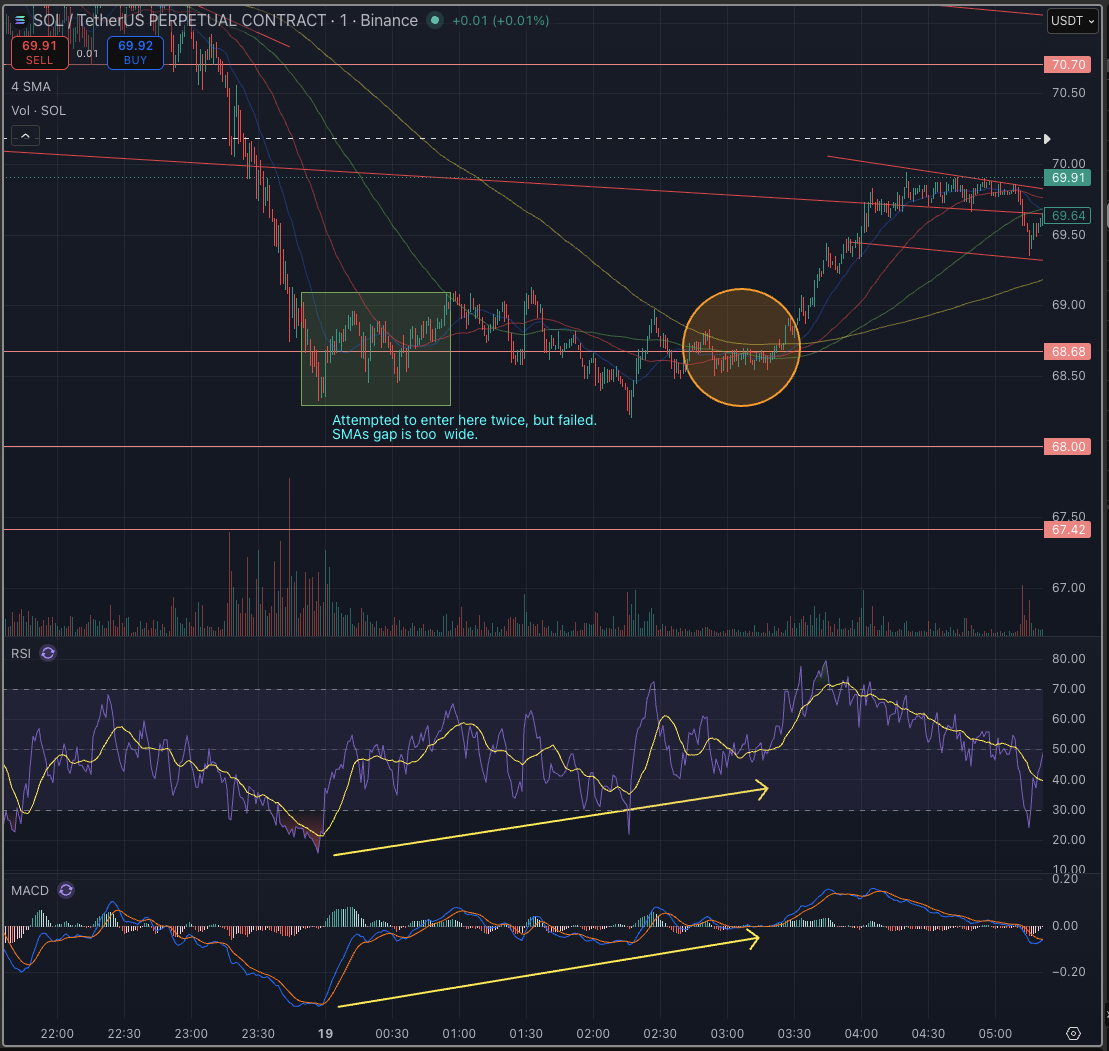
Take note: on 1m chart, during accumulation breakout, all SMAs needs to be squeezed /compressed/converged.
This usually suggests:
- Low volatility
- Market indecision / consolidation
- Energy building for a larger move
- A potential trend change if the MAs are flattening and converging
Plans
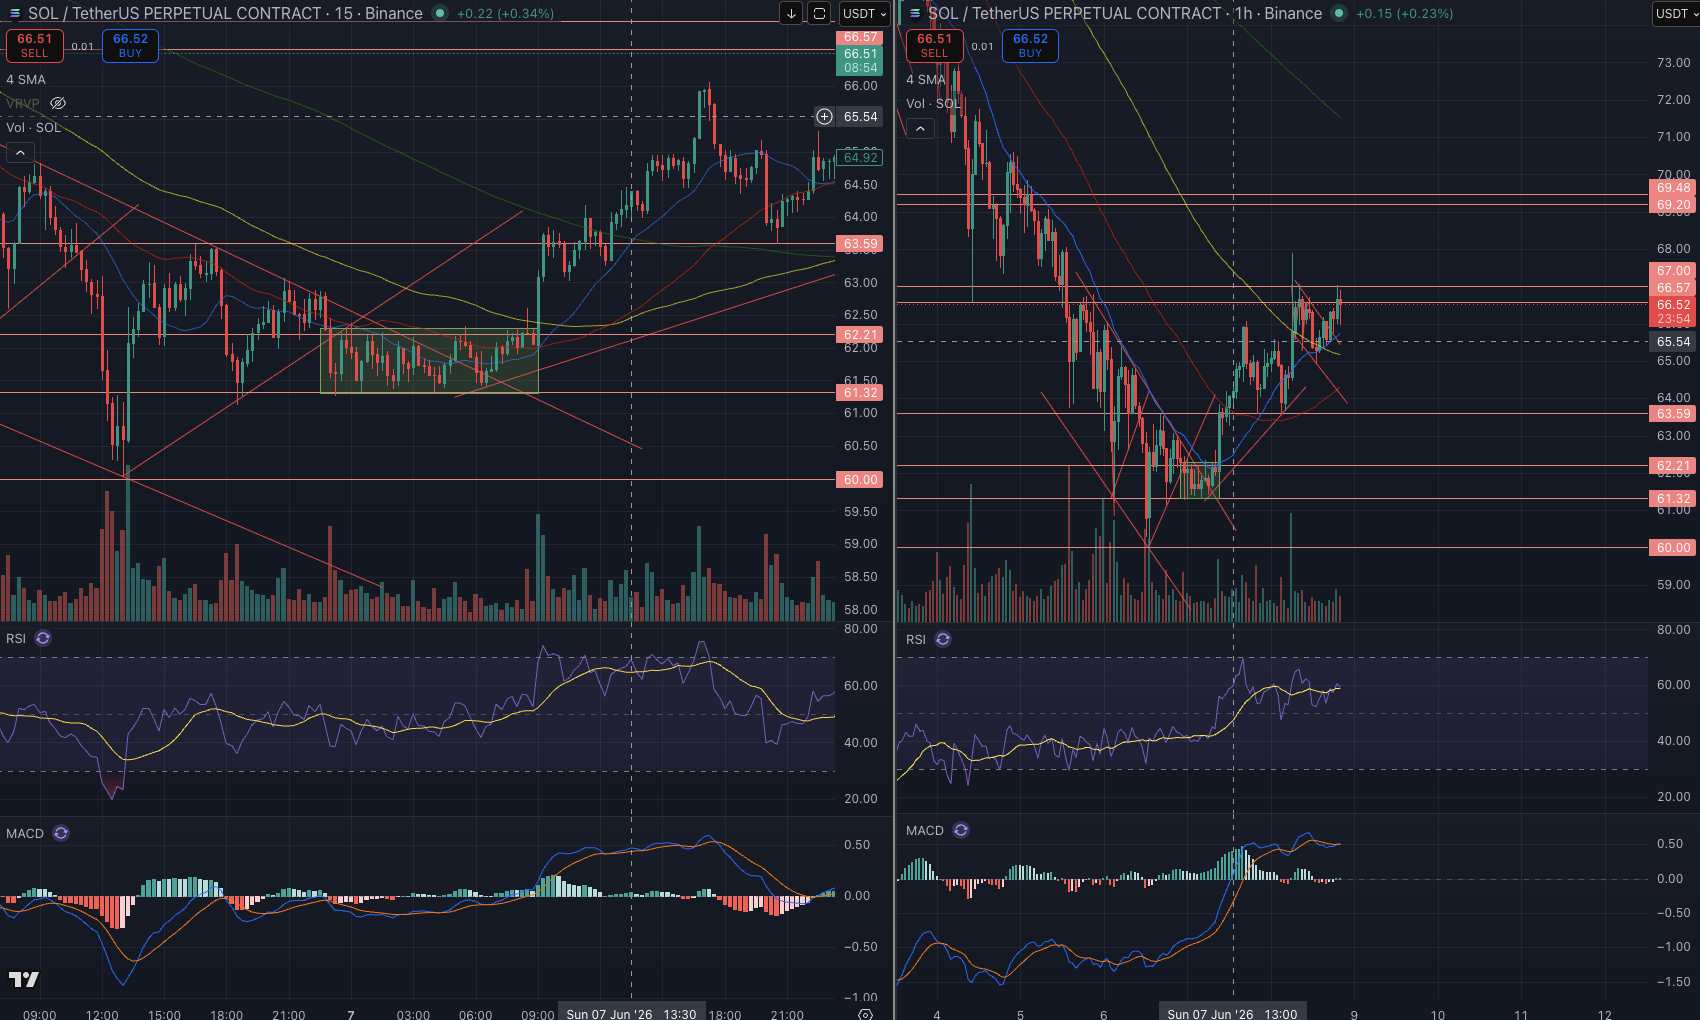
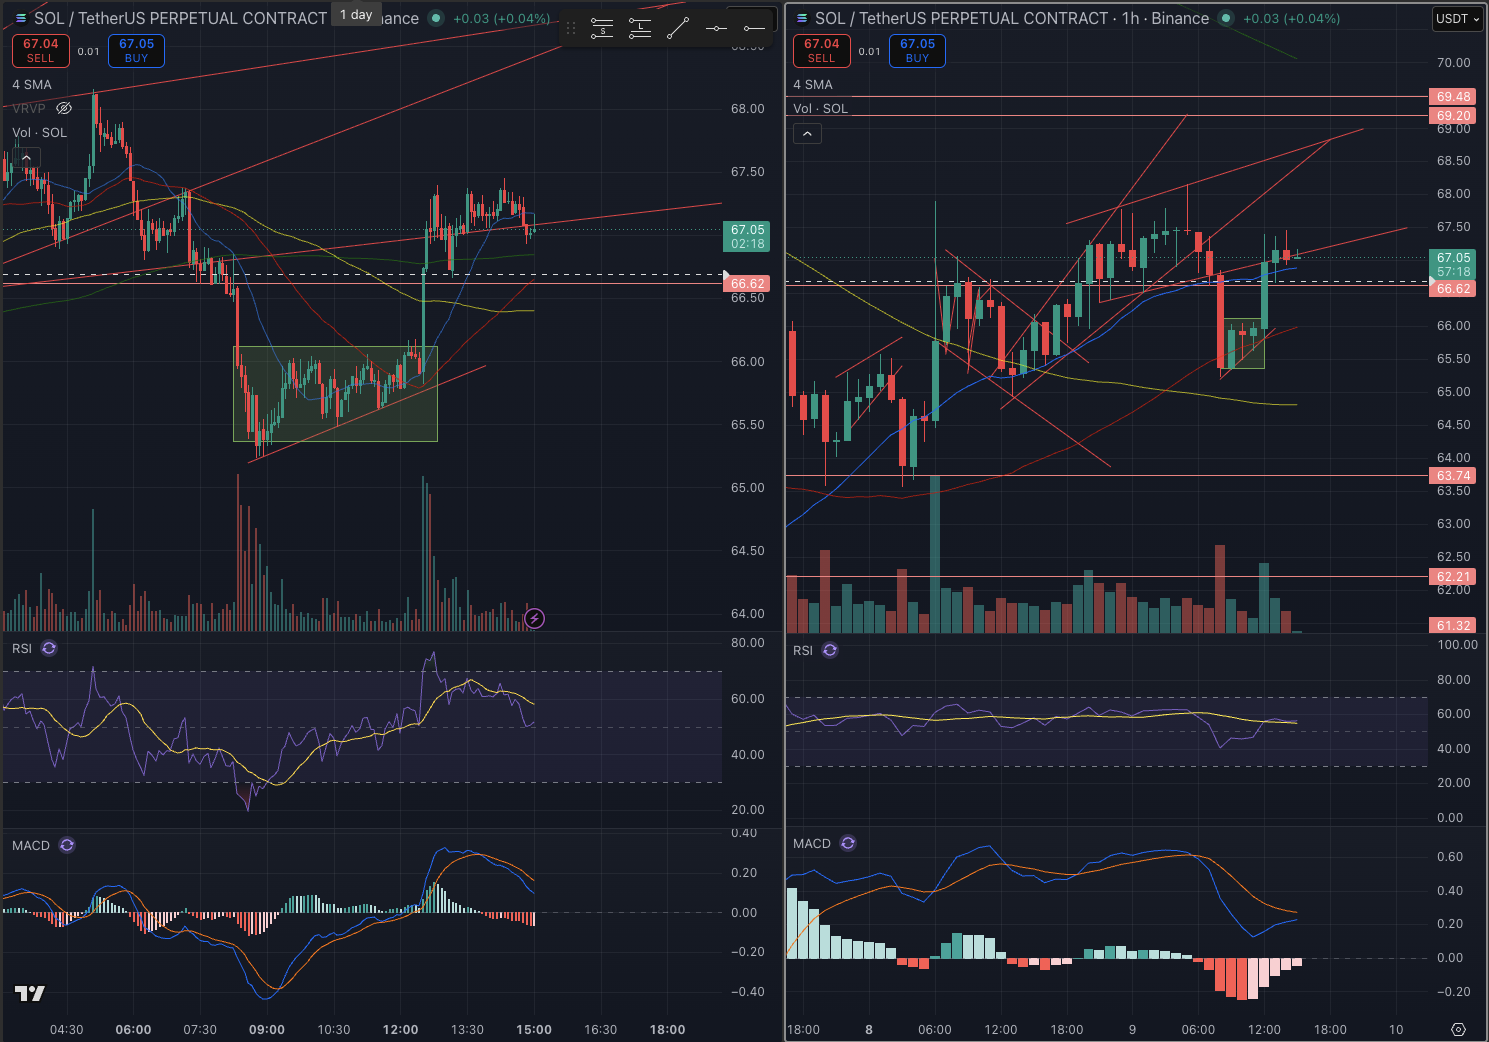
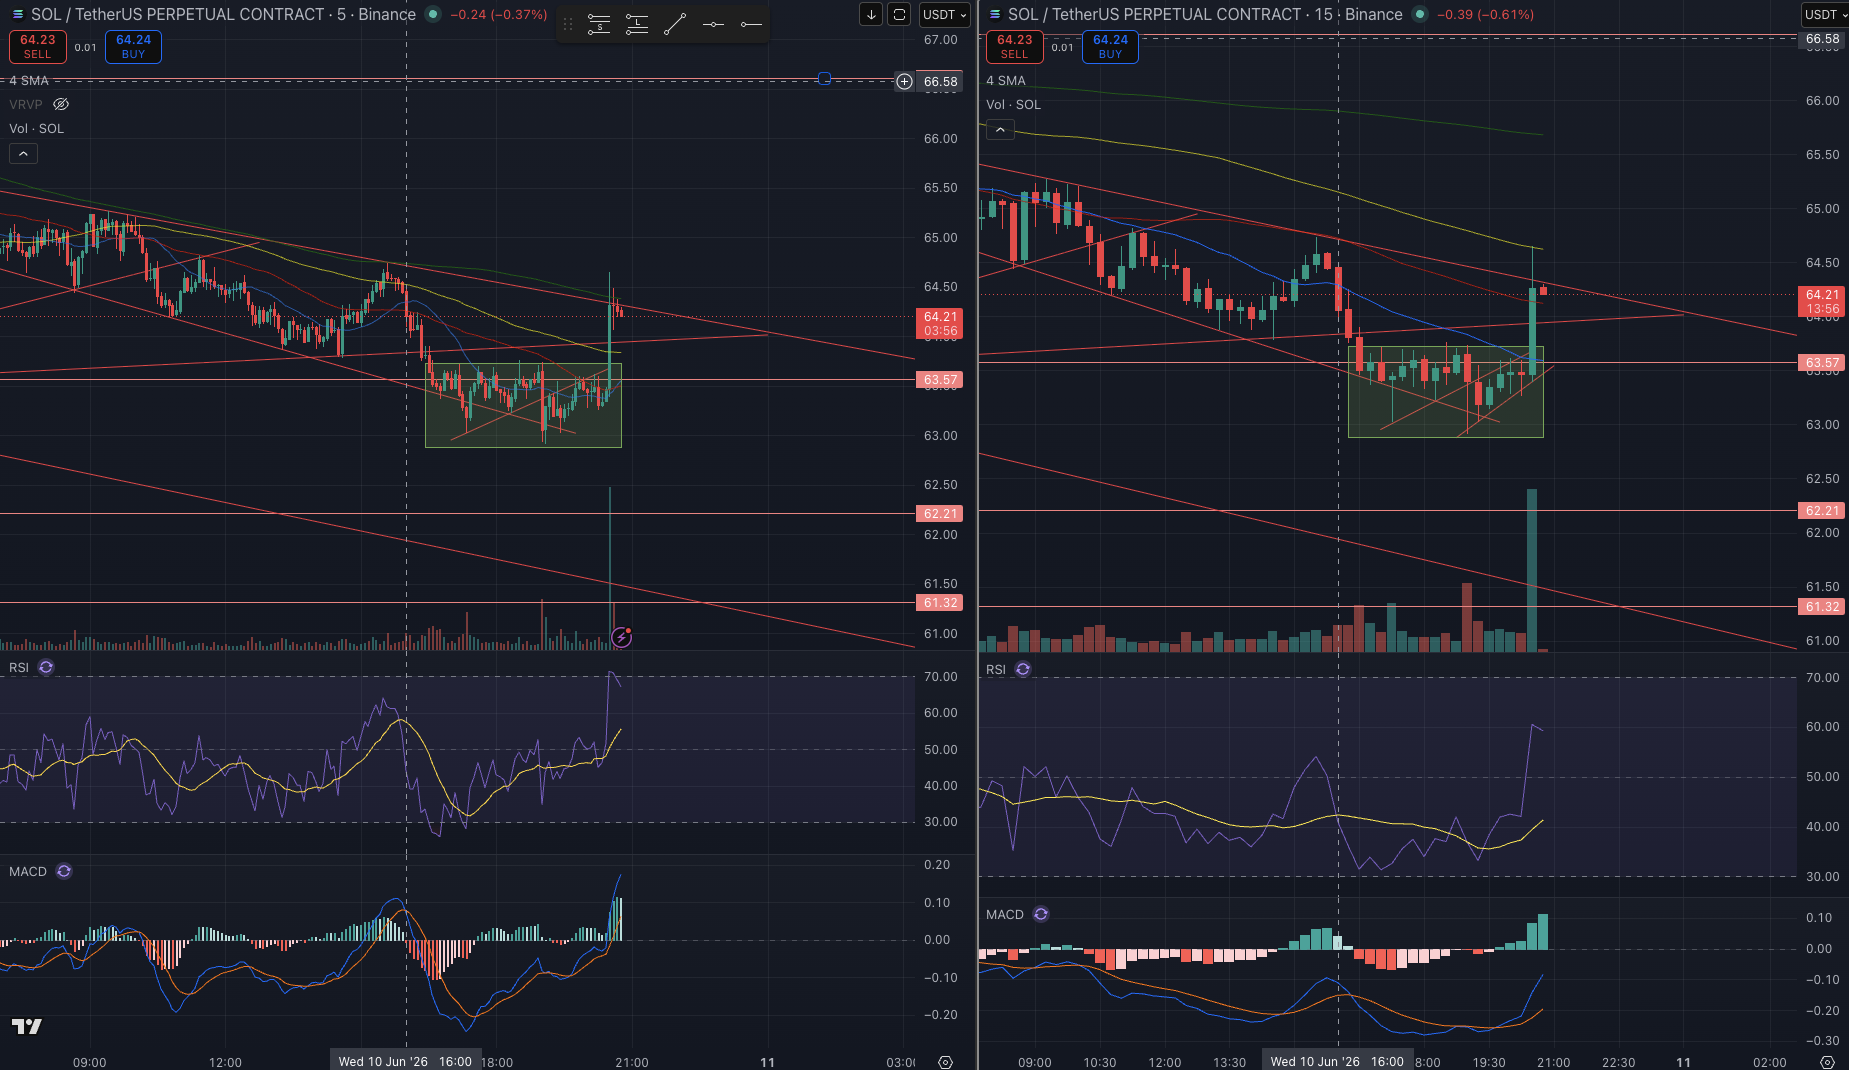
Here're a few of the trades I have executed with great success.
- Price trap in a buy sell channel and narrow.
- SMA crosses and act as support, the price gain support and slope toward a breakout.
- To spot this early, switch between 1m or 5m chart for entry
- TP at 1H or 4H resistance above. Spot for strong resistance